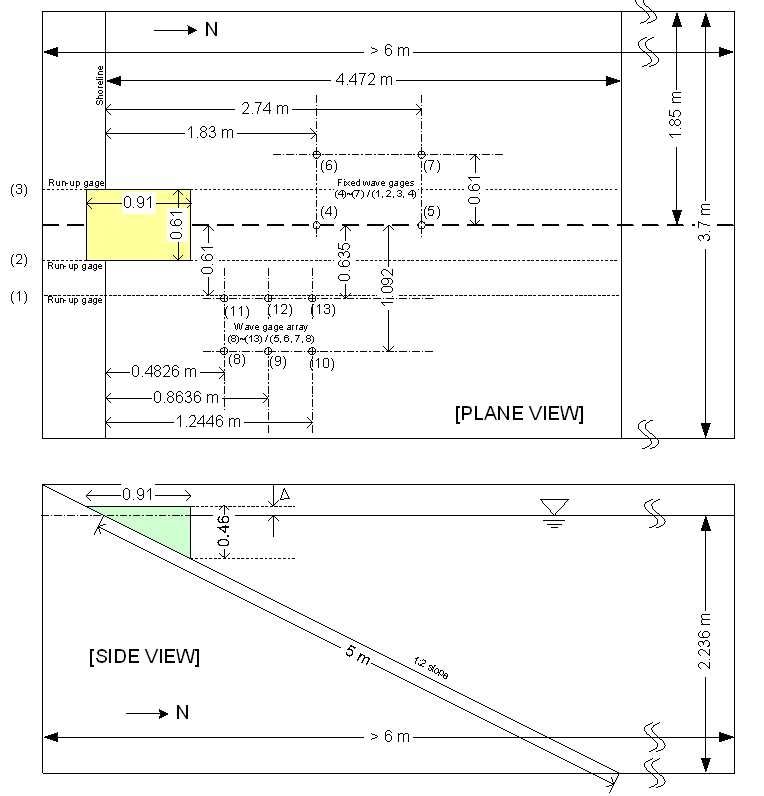
An overview of the 3D landslide setup is shown below. The blue indicates the initial water surface, and the wedge is going to slide down into water and generate waves. The beach slope is 1:2 and the tank width is 3.7 m. Click here to see the animations.
Subaerial Landslide Animation (3.41MB):
The plan view and the side view of the setup are shown below:
In their experiments, they installed three run-up gauges on the beach, four fixed wave gauges in front of the wedge, and a wave gauge array with six wave gauges. The comparisons are shown below:
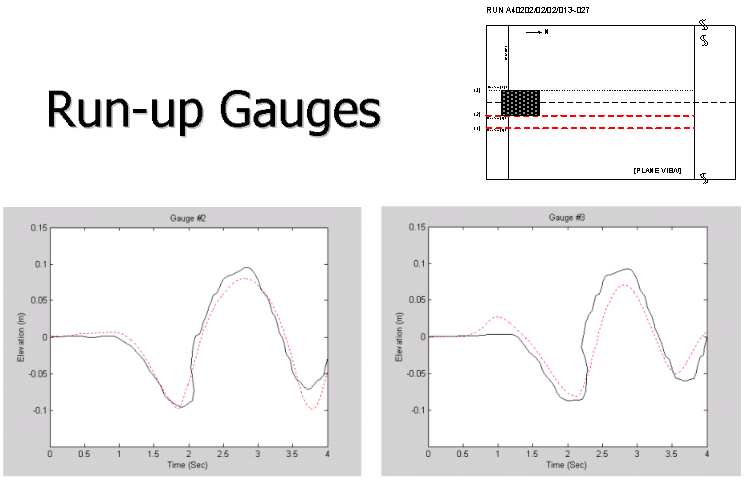
[Run-up gauges]
The run-up gauges are installed on the slope. The locations of the gauges can be seen from the small plan-view figure on the top-right corner. The blue solid lines are the numerical solutions, and the red dot lines are the experiment measurements. The numerical solutions provide reasonable good results in terms of maximum and minimum run-up heights, and phases. We shall notice that after t=3.5 sec, the numerical solutions are smeared by the reflecting waves from the right-side wall.
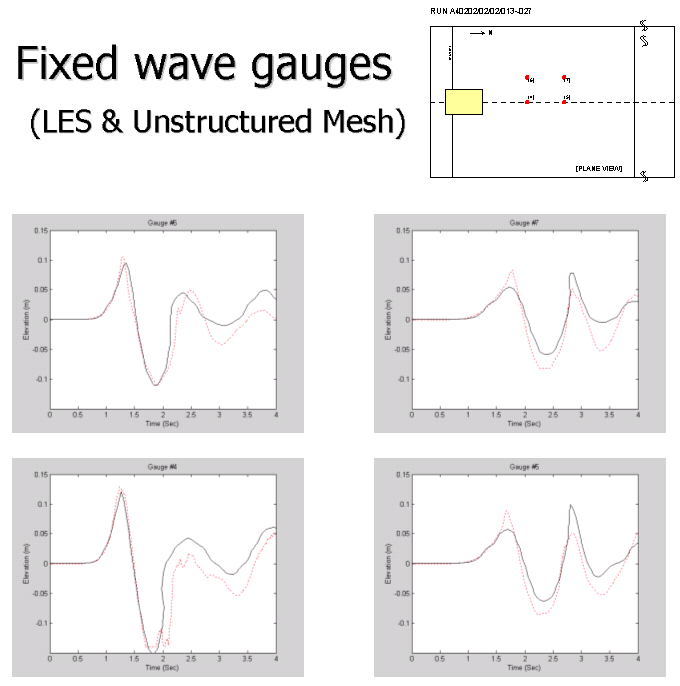
[Fixed wave gauges]
There are four fixed gauges installed in from of the wedge in a distance of 1 to 2 wedge length to the initial shore line. The locations of the gauges can be seen from the small plan-view figure on the top-right corner. The blue solid lines are the numerical solutions, and the red dot lines are the experiment measurements. The numerical solutions provides reasonable good results in terms of maximum and minimum run-up heights, and phases. We shall notice that after t=3.5 sec, the numerical solutions are smeared by the reflecting waves from the right-side wall.
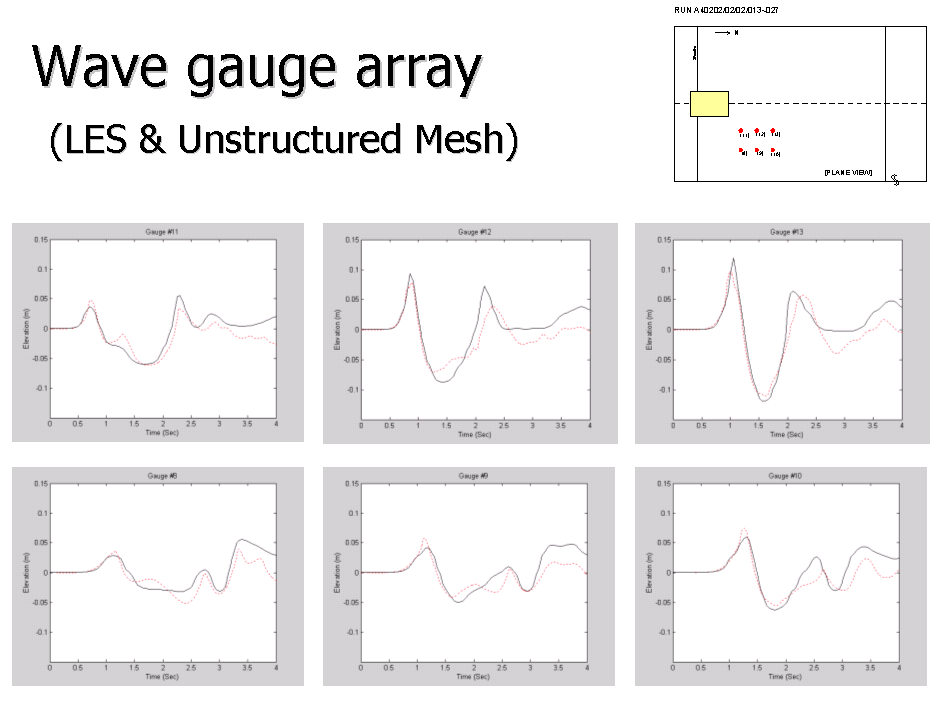
[Wave gauge array]
There are six gauges installed on the side of the wedge. The locations of the gauges can be seen from the small plan-view figure on the top-right corner. The blue solid lines are the numerical solutions, and the red dot lines are the experiment measurements. The numerical solutions provide reasonable good results in terms of maximum and minimum run-up heights, and phases. We shall notice that after t=3.5 sec, the numerical solutions are smeared by the reflecting waves from the right-side wall.